Running a business produces a lot of numbers every single day: sales receipts, invoices, inventory lists, bank balances, and customer reviews. The trouble is, these numbers live in five different places.
When you sit down at the end of the week and ask "How are we doing?", finding a straight answer means opening multiple spreadsheets, asking managers for updates, and doing manual calculations on a calculator. By the time you get the answer, the information is already out of date.
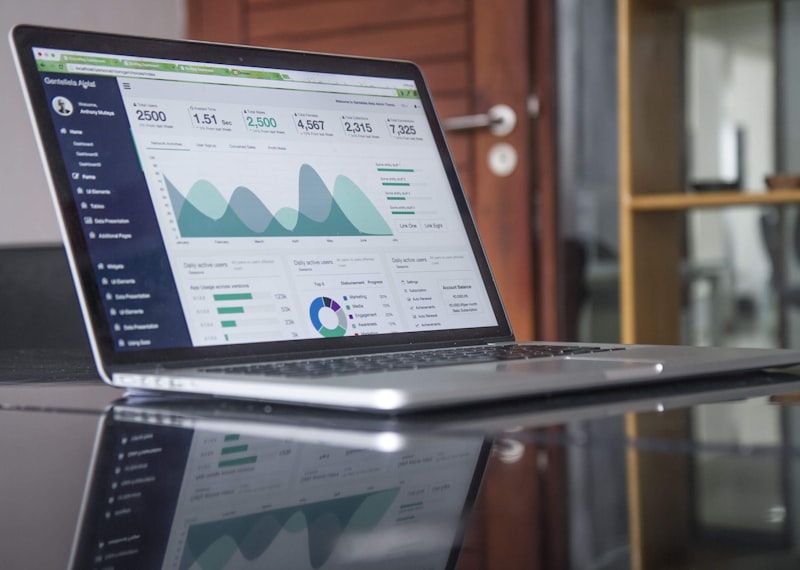
Business Intelligence (BI) is simply a cleaner way to see your numbers. It takes data from your sales register, bank, and website, and turns them into one clean visual dashboard that you can check from your phone in thirty seconds.
What a Great Dashboard Shows You at a Glance
You do not need fifty complicated charts. A clean business dashboard answers the questions you care about most:
1. Real-Time Revenue and Profit
See exactly how much money came in today, this week, and this month compared to your targets. Green numbers show you are ahead, and gentle alerts warn you if sales are dipping so you can react quickly.
2. What is Selling and What is Stuck
Know your top-selling products and services immediately. Spot which items are running low on stock before customers get disappointed, and identify slow movers so you do not order excess stock.
3. Customer Happiness and Retention
Track how many new customers visited versus returning loyal clients. Knowing who keeps coming back helps you thank your best clients and run better promotions.
4. Expenses and Operating Costs
Keep a clear eye on your overhead. Watch utility, supply, and staff costs side by side with revenue so your net margins stay healthy.
Spreadsheets vs. A Modern Dashboard
Why business owners are switching from messy Excel sheets to clean visual dashboards:
| Feature | Manual Spreadsheets | Modern GTS Dashboard |
|---|---|---|
| Updating | Manual typing and copy-pasting every week | Updates automatically every single hour |
| Mobile View | Pinching and zooming tiny cells on your phone | Clean, beautiful cards built for mobile screens |
| Accuracy | Easy to break formulas or enter wrong numbers | Direct connection ensures 100% accurate data |
| Speed | Hours of preparation before every meeting | Instant view ready whenever you need it |
How GTS Builds Your Dashboard
Zero Technical Jargon
We do not bore you with database talk. We ask you what three questions keep you up at night about your business, and we build a clean screen that answers them instantly.
Here is our straightforward approach:
- Connect Your Existing Tools: Whether you use QuickBooks, Excel, Shopify, or local POS systems, we plug into them safely.
- Clean and Organize: We remove duplicate records so your numbers are clean, honest, and reliable.
- Design Clean Charts: Big bold numbers and clear colors that anyone on your team can understand immediately.
- Secure Access: Give managers access to what they need, while keeping sensitive numbers private for ownership.